Version HTML de base


9
Characterisation of sound absorbing materials
Since the air in the pores does not support any shear wave,
the shear velocity and damping is only slightly influence by
the air saturating the pores. The main disadvantage is that
this measurement typically results in a shear modulus at
a few hundred hertz, whereas for a lot of applications, the
elastic coefficient is needed at much higher frequencies.
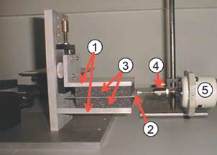
Fig. 2 : Set-up to measure the shear modulus of the frame.
1) rigid plate ; 2) moveable plate ; 3) sample ; 4)
B&K 8001 impedance head ; 5) shaker (from [3])
One way of overcoming this frequency limitation is to extract
the elastic modulus from th phase velocity of propaga-
ting waves [12]. This way, the only frequency limitation
that remains is a result of the increasing attenuation as a
function of frequency : at a certain frequency the signal
to noise ration is not good enough.
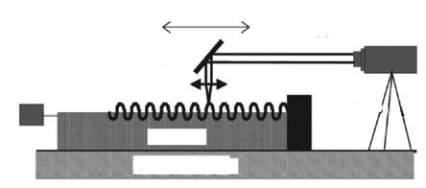
A typical set-up consists of a relativity large slab of the
material, a mechanical shaker to generate waves in the
structure and a detector, preferentially a laser Doppler
vibrometer that can scan the sample as a function of posi-
tion. Figure 3 shows a setup from ref [3].
Fig. 3 : Typical set-up for the measurement of
propagating mechanical waves. From ref [14]
A shaker generates harmonic plane waves at one end of a
porous slab (typically a few square meters in size). These
waves propagate at the surface of the sample and reflect
at a rigid termination, forming a standing wave. The wave-
number can be determined with a scanning laser Doppler
vibrometer. If the frequency is high enough so that the
thickness of the sample is more than a few wavelenghts,
only a Rayleigh-type wave can propagate and the extrac-
tion of the shear modulus from the phase velocity is rela-
tivity easy. Any dispersion that is observed as a function
of frequency is the result of the frequency dependence of
the elastic coefficients of the material. When the wavelen-
ght is too large, the porous slab acts as a waveguide and
multiple dispersive modes can propagate. The pahse veloci-
ties of the different modes can be extracted by performing
a (space ⁄ wavenumber) Fourier Transform of the displace-
ment as a function of position of the standing wave in front
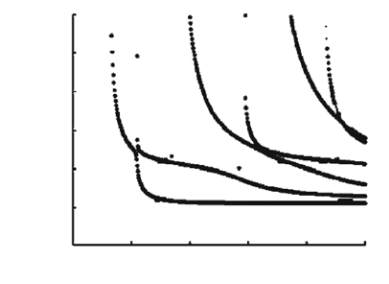
of the rigid termination. Figure 4 shows the typical disper-
sion curves that can be obtained in this configuration.
Fig. 4 : Typical dispersion curves for the configuration of figure 3
This configuration is easy to establish, but since the data
need to be windowed before the FFT calculation, there
is a slight sensitivity of the result on the type and posi-
tion of the window. On top of this, the shaker does not
couple a lot of energy to the foam which can be detrimen-
tal to the signal to noise ratio. Different variations of this
method have been tried, including extracting the disper-
sion curves from a 2D FFT (space, time) ⁄ (wavenumber,
frequency) when the source generates broadband bursts
or using Time Frequency analysis [15,16].
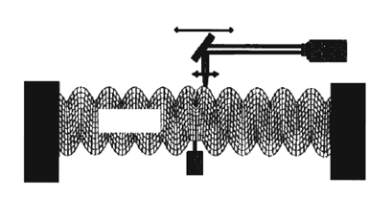
To overcome these problems, a symmetrical set-up is
preferential. This is shown in figure 5.
Fig. 5 : Symmetrical set-up for the generation
of guided modes in a porous slab
The configuration is now in a «Lamb» condition (free surfa-
ces on top and on bottom). The shaker couples much more
energy to the foam and due to the symmetric clamping
conditions left and right, no spatial windowing in neces-
sary. Figure 6 shows some typical standing wave patterns
and the corresponding Fourier Transform. Each «peak» in
the Fourier Transform corresponds to the wavenumber of
a mode excited in the layer.
Laser Doppler vibrometer
Mirror
Focusing lens
Rigid backing
Air
Sample
Rigid substrate
Shaker
Laser Doppler vibrometer
Mirror
Focusing lens
Air
Sample
Rigid end
Shaker
Air
Rigid end
0
50
100
150
200
250
600
500
400
300
200
100
a)
Real part of phase velocity (m/s)
Frenquency*thickness (Hz*m)