Version HTML de base


64
Spécial “ 5es Assises sonore ”
Acoustique
&
Techniques n° 51
Noise mapping for railway noise: assessment of NMPB method as implemented in different software, comparison with RMR method
Considering overall noise levels at the four receivers,
Mithra provides the most accurate results. Considering
noise spectra, Mithra overestimates noise levels at low
frequencies with a low impact on the dB(A) due to the A
weighting.
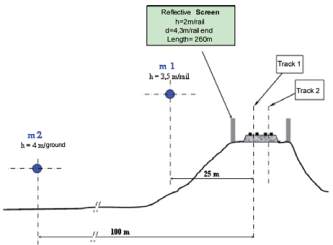
Real case 2: TGV-D with noise barriers
The same comparison is carried out now with a noise
barrier between noise source and receivers. Measurements
are carried out on a test site located few kilometres on
the north of the previous one. The railway track is also
equipped with UIC 60 rail and bi-block concrete sleepers
over ballast. The concrete noise barrier is 260 meters long,
2m high above the rail and is positioned at 4,3 meters from
the rail end. Noise measurements where carried out with
TGV-Duplex train at three different pass-by speeds: 200,
300 and 350 kph. Two receivers are located at a distance
of 25 m and 100 m as presented figure 9.
The results compared for 3 running speeds confirm the
influence of the source model. The results at 300 kph as
they are representative, are presented in table 3.
The noise source located 4m high in the RMR high speed
train model leads to a more accurate prediction behind a
noise barrier.
Conclusions
As in France, the official method for railway noise mapping
is NMPB, a comparison of NMPB and the interim Dutch
method (RMR) recommended by the Directive has been
conducted. In the same time, Mithra, CadnaA and Immi
softwares have been compared.
The comparison of the NMPB method in Mithra and CadnaA
shows that the results are quite similar in very simple
cases. The difference can reach 2.5 dB(A) depending on
the meteorological conditions and the ground absorption.
The comparison of the both methods, NMPB and RMR,
confirms the correspondence between the reference
emission values from SNCF and train categories of the RMR
method (in CadnaA and Immi
softwares). For trains running
at conventional speed, NMPB
tends to overestimate the
predicted sound pressure
levels. The main difference
concerns the simulat ion
with high speed trains for
which the source models are
different in both methods. As
high speed train is defined
with noise sources located
at from 0,5m to 4 m above
the rail in the RMR method,
the prediction behind a noise
barrier is more accurate than
with the NMPB. In free field
conditions, both methods
provide the same noise levels
and after comparing with
real measurements they are
proved to be accurate.
Bibliography
[1] RMR. R.Reken-en Meetvoorschrift.
Railverkeerslawaai ‘96Calculation and
Measurement Guidelines Road and
Railway 1996. Ministerie Volkshuisvesting.
[2] NMPB FER-98.Bruit des Infrastructures ferroviaires. SNCF,RFF,CSTB,DTT,
1998
■
Fig. 9 : Measurement site schema
Représentation du site de mesures
High speed train
Measure-
NMPB CADNAA
Measure-
NMPB MITHRA
Measure-
RMR CADNAA
Receiver at 25 m
13,3
12,8
3,6
Receiver at 100 m
15,4
14,9
8
Table 3 : Difference of measured and calculated noise levels at 300 kp/h
Différences de niveaux de bruit entre mesure et calcul, à 300 km/h