Version HTML de base


Spécial “ 5es Assises sonore ”
63
Acoustique
&
Techniques n° 51
Noise mapping for railway noise: assessment of NMPB method as implemented in different software, comparison with RMR method
The same configuration with freight trains confirms the
main role of the source model. As the noise sources of
the freight trains are located near the rail, the results are
very similar in both methods.
Comparison of measured and calculated
noise levels
After carrying out a theoretical
comparison of the different
calculation methods, a validation
with real measurements was
developed.
Pass-by noise measurements
of TGV-Duplex were carried out
with and without noise barriers.
These measurements have
been compared to the following
calculations :
- Pass-by of a TGV-D calculated
with the NMPB method in Mithra
software
- Pass-by of a TGV-D calculated
with the NMPB method in CadnaA
software
- Pass-by of “category 9”
calculated with RMR method in
CadnaA software.
Real case 1: TGV-D without
noise barrier
The measurement site is located
in Pierrelatte in the Paris-Marseille
high speed line.
The measurement site presents
f ree f ield condi t ions. The
ballasted track is equipped with
UIC 60 rai l and mono-block
concrete sleepers. The train runs
at 300 kph and is composed by
10 vehicles. Four receivers are
located at four different distances
from the track:
- m 20 : receiver at 7,50 m from
the centre of the track and 1,20
m above the rail.
- m 21 : receiver at 25 m from
the centre of the track and 3,50
m above the rail.
- m 150 : receiver at 150 m from
the centre of the track and 4 m
above the rail.
- m 24/25 : receiver at 300 m
from the centre of the track and
4 m above the rail.
The test site has been modelled in
Mithra and CadnaA softwares. The
comparisons between measured
noise levels and calculated noise
levels are shown figure 7 and 8.
The comparison of the overall
noise levels is summarized in
table 2.
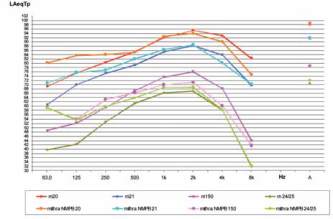
Fig. 7 : Comparison of measured noise spectrum during the passage of TGV-D and
calculated noise spectrum with NMPB by means of Mithra software
Comparaison de spectre de la mesure de bruit durant le passage
d’un TGV-D, calculé avec la NMPB et le logiciel Mithra.
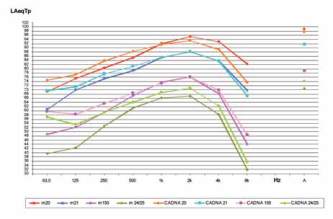
Fig. 8 : Comparison of measured noise spectrum during the passage of TGV-D and
calculated noise spectrum with category 9 (RMR) by means of CadnaA software
Comparaison de spectre de la mesure de bruit ambiant durant le passage
d’un TGV-D, calculé avec la catégorie 9 de RMR et le logiciel CadnaA
Difference in noise
levels
Measures-NMPB
MITHRA
Measures-NMPB
CADNAA
Measures-
RMR CADNAA
Receiver at 7,5m
0,8
1,2
1,4
Receiver at 25m
-0,3
-0,3
-0,1
Receiver at 150m
0,8
-0,7
-0,3
Receiver at 300m
-1,5
-2,5
-3,4
Table 2 : Difference of measured and calculated noise levels
Différences de niveaux de bruit entre mesure et calcul