Version HTML de base


“Uncertainty-noise” Le Mans
39
Acoustique
&
Techniques n° 40
The RT method can be very precise in detail, because the
possible rays are constructed in a deterministic way. This high
accuracy has it’s price – the number of possible rays explodes
with increasing reflection order. This is no problem in large
scale noise mapping, because with both methods only first
order reflections are included generally. But multi reflection
influences in narrow roads must be included by an additional
correction with RT methods.
But as both strategies have their pros and cons, it is the
optimal solution to use a software where this strategy can
be selected.
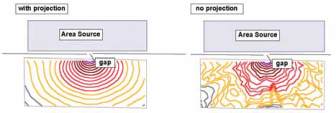
In that case it is recommended to inspect carefully to the
patterns of calculated noise contours. These are a very
sensitive instrument to detect and quantify errors and
uncertainties. If noise contours flounce and show irregular
and unexpected patterns, this is not an esthetical problem, but
proves that errors depending from the position of the receiver
point are produced. The same errors occur if the levels are
calculated at defined points. It is recommended to use test
samples with very precise defined situations where the correct
result is well known to investigate these deviations produced
by program strategies. In the examples figure 10 it is obvious
that the projection method increases the accuracy.
Receiver and people affected
The END requires to produce the distribution of people affected
by noise in intervals of L
den
. This L
den
shall be determined at
the most exposed façade.
As shown in figure 8, the L
den
at the most exposed façade
of a building can be found by calculating these levels directly
distributed around the façade and taking the maximum. The
same procedure shall be repeated exclusively for buildings
with a “quiet” façade. Unfortunately the level at the quiet
façade has to be determined in a distance of 2 m from this
façade – this would require two complete calculations of the
building noise map.
It would be advantageous to use the same small distance
at both sides, but this needs an investigation about the
uncertainty that is introduced by that deviation from the END
requirement.
This was done using again the city model of Augsburg. To
find the influence of the distance of the receiver point that
determines the quiet façade, the complete calculation and
analysis as defined in Annex VI of END was done with varying
distance of the calculation point.
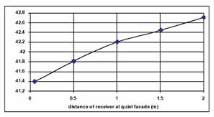
About 6000 buildings in Augsburg can be qualified as buildings
with a quiet façade. Figure 11 is based on 5 calculations of
this city model and it shows, that there is only a difference of
about 1 dB calculating with 0.05 m
or with 2 m distance. This cannot
justify to double the calculation
time: based on these results it can
be recommended to calculate with
uniform small distance from the
façade. To get comparable results
for all cities a building should be
qualified as a building with a quiet
façade if the maximal and minimal
façade levels differ by 21 dB or
more.
These few examples show that a
careful and responsible analysis
of uncertainties in noise prediction
is complex and covers many
influences. The simple question: “How accurate is a noise
map?” cannot be answered by one number the time being. It is
highly recommended to combine with any further development
a very thorough inspection of the possible improvement for the
end result on the basis of uncertainty measures. Unfortunately
the existence of powerful software for noise prediction
encourages many experts to modify existing methodologies
more and more – the result are methods where the user
must trust his software and where even plausibility-checks
are extremely time consuming or even impossible. In some
of these cases it can be stated: Lesser is often better.
Bibliography
[1] Directive 2002/49/EC of the European Parliament and of the Council of 25
June 2002 relating to the assessment and management of environmental noise
[2] ISO Guide to the expression of uncertainty in measurement, International
Organisation for Standardisation, ISBN 92-67-10188-9, 1993
[3] H.C. Borst, H.M.E. Miedema: Comparison of Noise Impact Indicators,
Calculated on the Basis of Noise Maps of DENL, ACTA ACOUSTICA Vol. 91, p.
378 – 385, 2005
■
Fig. 10 : Noise contours produced with projection on and
off – projection off with larger uncertainty
Fig. 11 : Level at the quiet façade (mean of
about 6000 buildings) versus distance
Uncertainties in the prediction of environmental noise and in noise mapping