Version HTML de base


38
“Uncertainty-noise” Le Mans
Acoustique
&
Techniques n° 40
Meteorological influences may increase with larger distances.
All our comparisons measured-calculated levels show that
differences are small nearby but grow with distance. To study
the possible influence of an improvement of the calculation
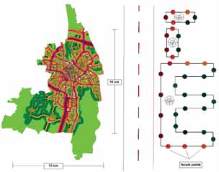
methodology the digital model of the city of Augsburg has
been used. It comprises 147 km² agglomeration with 79416
buildings, 704 km acoustically relevant roads and 271725
inhabitants.
The two types of calculation applied are shown in figure 8.
The whole project file with all objects, the 10 m grid and the
façade levels for all buildings comprises 233 MB. With the
two types of map calculated the number of people exposed
distributed in level intervals and the total annoyance score [3]
have been determined.
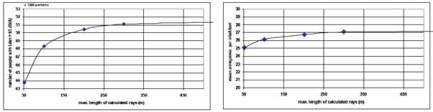
With a special compilation of the used program CadnaA it is
possible to sum up only those contributions at the receivers
that are produced by rays shorter than a defined maximum
length – this length restriction is even used for angled reflected
ray paths. For maximal lengths of rays of 50 m, 100 m, 200 m,
300 m and with all rays the complete noise maps of Augsburg,
the level at the most exposed facades and from these the
number of people exposed have been repeatedly determined.
Each point in the diagrams figure 9 is a new calculation for
the complete city and an evaluation of exposed people based
on the L
den
.
These results figure 9 prove, that the long distance
propagation and the meteorological influences are not
important for strategic noise mapping in agglomerations.
The distances 0 to 150 m determine the uncertainty of the
end result, and expenditures to improve the methodologies
of the calculation of sound propagation will not change any
of the results found with the existing conventional methods. It
is rather to fear that the disadvantages of more complex and
not simple controllable methods will increase the uncertainty
of the final result.
The same way we can investigate the influence of each
parameter on the result. Our experience is that it is important
to define this end result clearly before the contribution of
uncertainties of parameters is investigated. If the “total
annoyance score” of a city shall beminimized, then rather simple
and crude methods are sufficient. Traffic rearrangements and
improvement of road surfaces influence the noise levels on
larger areas, and the decision is influenced by mean levels
and not by noise levels at defined positions.
This “punctual” uncertainty is important if legal requirements
have to be met and this should be proved by a calculation in
the planning phase.
Some uncertainties are introduced by the numeric methods
used – they have nothing to do with physics and are therefore
nearly undetected by users of software tools. The following is
only a brief summary with some of these aspects.
All software for noise mapping can be classified in one of the
two groups “angle scanning (AS)” and “ray tracing (RT)”.
With AS the calculation starts from the receiver point and
follows straight lines arranged in definable angle steps. Only
those objects are seen and taken into account, that are crossed
by these rays. The resolution of the method decreases linear
with increasing distance – if narrow angle steps are used to
get an acceptable accuracy, the calculation times increase
unacceptable with large mapping projects. Another problem
with AS is that reflectors near the source are not detected if
many objects like buildings or barriers are between source
and receiver.
The advantage of the AS method is that calculation of high
reflection orders at facades at buildings facing the road can
be very quick, because in that case the time consuming
calculation of reflected rays coming from outside the “road-
space” can easily be suppressed. Even if the uncertainty of
each single ray-calculation may be large - if there are reflecting
buildings at both sides, many reflections contribute to the
result and the uncertainty of each single contribution is not
important.
Fig. 8 : Noise map of Augsburg: 10 m grid
(left) and facade levels (right)
Fig. 9 : People exposed with L
den
> 65 dB(A) (left) and mean annoyance score per
inhabitant in dependence of maximal ray length calculated
Uncertainties in the prediction of environmental noise and in noise mapping