Version HTML de base


50
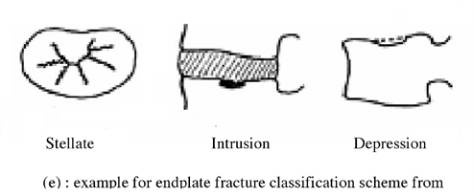
Fig. 5 (e) : Failure modes for applied stresses
of 60% the ultimate stress
- Endplate depression: endplate deformed into a bowl
shape the trabecular bone below the endplate fractured
(figure 5 c, d and e).
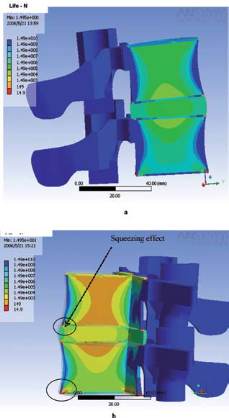
It can also be observed a squeezing effect on the endplate
side (figure 5 b).
Figure 6 describes the number of cycles to failure for
L4/L5.
Two levels of stress have been applied compared to the
ultimate stress: a)
∆
σ
/
σ
u
= 30% and b) = 60%. Two modes
of fractures can be observed: intrusion of the disc mate-
rial into the trabecular bone and by endplate depression
and the squeezing effect can also be observed.
Numerical fatigue behaviour of vertebrae
Using the FE model of the motion segment L4/L5 and
experimental curves
σ
a
-N for all components (section 3.0:
behaviour fatigue), a fatigue analysis was made. For each
excitation, the FE model computes the alternate stress
σ
a in all elements and provides a fatigue sensibility for
each component of L4-L5 (trabecular bone, cortical bone,
endplate, and intervertebral disc).
The results show that under a pure compressive harmonic
load, the trabecular bone and the endplate of L4-L5 are
more subject to failure. Figure 7 shows the number of
cycles to failure for a driver exposed to a vibration at the
natural frequency of its lumbar spine (about 5 Hz).
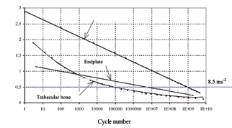
Fig. 7: Number of cycles to failure for a intermediate driver
The distribution of the number of cycles to failure N in the
cortical bone is greater than 10
9
cycles for an alternate
stress of 0.5 Mpa which is corresponding to an accelera-
tion excitation of 8.5 m s
2
. For an applied stress of 0.5 Mpa
that corresponds to 30% of the ultimate stress of whole
vertebrae, the number of cycles before failure of trabecu-
lar bone is reduced to 100 000 cycles. If the applied alter-
nate stresses are greater than 1 MPa (that corresponds
to 60% of the ultimate stress of whole vertebrae), the
number of cycles before failure of endplate and trabecu-
lar bone is reduced to 1000 cycles (
≤
1000 cycles). These
findings agree very well with those founded by experimen-
tal tests established by Brinckmann et al [13] and Hanson
et al [14] (Table 1).
Using our predictive model for dynamic stresses (Eq.7) and
by taking into account the effect of posture, damping and
morphology, the number of cycles before failure N can be
expressed as a function of the rms acceleration limit A (m/
s
2
) as measured at the driver’s seat applied at the natural
excitation frequency f
n
(Hz) of the lumbar spine.
Figure 8 describes the relation between acceleration at
the seat A (m/s
2
) and the number of cycles before failure
N. An acceleration A of 2.3 ms
-2
can thus be considered
as an endurance limit.
Fig. 6 : Number of cycles to failure of L4/L5 (a) for
∆
σ
/
σ
u
= 30% ; and (b) for
∆
σ
/
σ
u
= 60%
(a)
(b)