Version HTML de base


34
“Uncertainty-noise” Le Mans
Acoustique
&
Techniques n° 40
Uncertainties in the prediction of environmental
noise and in noise mapping
uantifying noise effects and/or annoyance by noise as
demanded by Directive 2002/49/EC (END) [1] on a large scale
needs the knowledge of the noise indicators at the where
about of the people living in an area and the relation between
these indicators and the harmful effects that shall be avoided
or minimised.
If the noise situation in our cities and communities in
different countries shall be compared based on the methods
described in this directive about environmental noise, it is of
great importance that we have some knowledge about the
uncertainties that are included in the whole process. We are
only able to decide if differences in the determined quantities
about noise for different cities are significant, if it can be
excluded that they are a result of a stochastic variation.
There are different methods used to describe uncertainties –
many expressions like accuracy, uncertainty, errors, deviations
and others are used in publications to describe what we need
at the end: a quantification of the reliability of the determined
quantities.
In International Standardization the concepts of GUM [2] are
widely accepted and used in the last few years. This concept
is transparent and powerful, because the dispersion of a
population of possible results is broken down to the dispersion
parameters of the different influences. This allows to rank
these influences and to find the best method to improve the
accuracy.
In some cases we use the concept of a theoretical “True
value” and qualify the possible deviation by “errors”. The
GUM – concept recommends to describe dispersed data as
population where a single element is defined by it’s value and
an uncertainty. This uncertainty is generally expressed as
momentum of 2.nd order or standard deviation.
Figure 1 shows an example. If many different persons
determine the sound power level of the same machine at
different times, we will get different results. If we present the
number of values in classes of decibels we get a presentation
as shown in figure 1. In this case the mean value is 78 dB(A)
and the standard deviation describing the dispersion is 3 dB. If
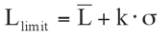
we approximate the values by a Gaussian standard distribution,
the level that is not exceeded with a given confidence can be
calculated using the coverage factor k
(1)
Referring to a normal distribution the coverage factor is 1,645
for a level of confidence of 95 % (one sided).
Wolfgang Probst
ACCON GmbH
Acoustic Consulting
Gewerbering 5
86926 Greifenberg
GERMANY
The uncertainty of predicted noise levels can be expressed as standard
deviation. In noise mapping each single value is a result of summing up the
contribution of many sources. A method is presented how to estimate the
uncertainty of the calculated noise level from the uncertainties of the emission
values of all sources, taking into account the uncertainty of the propagation
calculation. With strategic noise maps related to Directive 49/2002/EC
some further aspects come into play – these are investigated by calculating
the complete model of Augsburg city using alternative parameter settings.
Recommendations are given to find an optimal balance regarding all steps in
complete mapping projects.
L’incertitude des niveaux sonores estimés peut être traduite par un écart
standard. Dans la cartographie du bruit, chaque valeur est le résultat de la
somme des contributions de plusieurs sources. L’auteur présente ici une
méthode d’estimation de l’incertitude pour un niveau sonore calculé à partir
des incertitudes des valeurs d’émission de tous les sources, en prenant
en compte l’incertitude due à la propagation. Avec les cartes de bruit
stratégiques prévues dans la Directive 49/2002/CE, beaucoup d’aspects
complémentaires rentrent en jeu. Ceux-ci sont examinés grâce la modélisation
de la ville d’Augsburg qui utilise des montages alternatifs de paramètres.
Des recommandations sont données afin de trouver une balance optimale
concernant toutes les étapes dans les projets de cartographie
Q