Version HTML de base


18
Spécial “ Noise at work 2007 ”
Acoustique
&
Techniques n° 49
Barriers to occupational noise management
Results
There were 154 subjects (39 female, 112 male, 3
undeclared) who participated in this project from Tasmania,
Victoria and NSW in Australia. The average age was 39,
3 years (range 15 to 67 yr, SD 12, 5) while the mean
time in the workforce was 13 years (SD =
11, 5) with the
time in the current position ranging from two weeks to
50 years (mean =
10, 7 yr, SD 11, 0). The type of work
carried out by participants could be divided into five main
categories ‘laborer’, ‘operator’, ‘trades person’, supervisor
or ‘manager’, except for one individual who was a pilot.
Gender was spread evenly across the work types.
The average three frequency hearing loss at 3k, 4k, 6k Hz
for all participants was 21,7
dB HL (range 0 - 81
dB HL,
SD = 16, 9). Those individuals who declared they felt they
had a hearing loss had an average three frequency loss of
27,4
dB HTL (SD = 19, 5) while those who said they had
no loss had an average three frequency loss of 15,3
dB
HTL (SD = 10, 5).
Closed question analysis of perceived barriers
A factor analysis with varimax rotation (using Statistica
®
)
was performed on responses to the nine questions relating
directly to the perceived barriers to reducing noise at work.
This analysis revealed four prominent factors (Table 1)
accounting for 63 % of the total variance. The majority of
items displayed factor loadings higher than 0, 7. Two items
with factor loadings of 0, 67 and 0, 54 were included as
these loadings were well above the values for other items
and these two items add clarity to the interpretation of
the respective factors. The final column indicated whether
the ratings for the item were reversed prior to analysis.
Scale reversal was performed for these items to ensure
that a high rating consistently indicated a poorer approach
to reducing noise exposure. The four factors identified in
order based on the percentage variance accounted were
labeled
: Hearing protectors
; Information
; Culture
; and
Management.
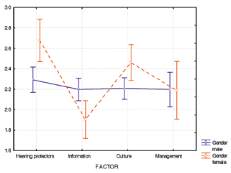
Further analysis revealed a difference in responses to the
barrier items between males and females, [F (3,402) = 5, 5,
p < 0, 001], Fig. 1. Comparisons show that results for three
of the barrier factors, hearing protectors, information and
culture, differed significantly between males and females
at the 0, 05 level (p = 0, 02, 0, 04 and 0, 04 respectively).
Females rated hearing protectors and culture more poorly
than males while males rated information more poorly than
females. However, the perception of barriers presented
by management was not significantly different between
genders (p > 0, 05).
Factor label
(proportion of total variance)
Individual questionnaire item
Factor loading Reversed for
analysis?
Hearing protectors
(0,20)
I do not like wearing earmuffs or earplugs
0,76
Yes
I cannot communicate using earmuffs or earplugs
0,70
Yes
Ear muffs and earplugs are uncomfortable
0,75
Yes
Information
(0,18)
I would like to know how to reduce noise
0,67
No
Work should supply more information on noise
0,84
No
Culture
(0,13)
I do not have time to do anything about noise
0,73
Yes
My mates at work do not worry about noise
0,77
Yes
Management
(0,12)
The management does try to reduce noise at work
0,81
No
The management at work is not interested in OHS
0,54
Yes
Table 1 : Summary of the factors from the analysis of responses to the nine, closed questionnaire items relating to barriers
Fig. 1 : Ratings for barrier factors showing significant
differences between men (N = 112) and women
(N = 39) [F (3,402) = 5, 5, p = 0, 001]. Vertical
bars denote 95 % confidence intervals
NOTE : Higher ratings indicate a poorer approach
to reducing noise exposure
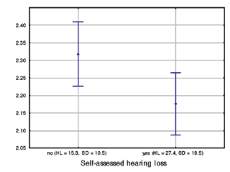
Fig. 2
: Comparison of overall rating of barriers for those who felt
they had a hearing loss (N = 80) and those who did not (N
= 71). People with a self reported hearing loss had lower
ratings, indicating a better approach to reducing noise
exposure [F (1, 135) = 4,78, p = 0,031]. Vertical bars
denote 95 % confidence intervals, point locates mean