Version HTML de base


Journée SFA / Renault / SNCF
11
Acoustique
&
Techniques n° 44
the normal incidence simulations). Figures 13, 14 et 15
show a discrepancy between the Alpha Cabin and the large
reverberant room growing towards the low frequency
with the performance of the materials (as already stated
in [10]), whereas the diffuse field simulation shows an
excellent correlation with the large reverberant room
measurements in all cases.
This proves that the constant correction coefficient
C=0,92 originally «designed» with the Alpha Cabin as a
correction in order to fit the results with large reverberant
rooms does not address the physics [12]… In fact, when
absorption (or better said the equivalent absorption
area) is growing, the field becomes less and less diffuse
and therefore more and more sensitive to the boundary
conditions (explaining why Alpha Cabins have to be
compared with one another).
The Ray-Tracing method gives a good representation of
those phenomena. If the beams meet high absorbing
surfaces they will vanish after only a few reflections: there
is then no diffusivity anymore.
These results validate this poro-elastic simulation chain
which allows to get reliable diffuse field absorption
coefficients from impedance tube measurements...
Transmission Loss
In the optimization phase, a MAINE 3A model is built for
each material construction in order to get both diffuse
field absorption coefficient and Transmission Loss.
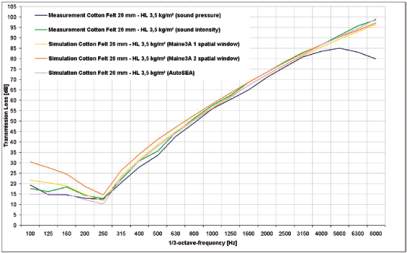
Figure 16 presents the same Cotton felt 1 200 g/m
2
20
mm thick as above, complexed with a 3,5 kg/m
2
heavy
layer on top of 0,7 m x 1 m steel plate 0,8 mm thick,
the Transmission Loss being measured in our horizontal
coupled reverberating rooms (cf. figure 12) first using
sound pressure and afterwards with an absorbing
environment in the reception room using intensity.
The Transmission Loss obtained from the pressure
measurement is not reliable any more above 4 000 H zdue
to a much too low signal to noise ratio in the reception
room. One can also see above 1000 Hz, the first effects
of flanking paths contributions, which will be even more
critical for heavy layers weighting more than 5 kg/m
2
.
The correlation between the measurement and the
simulation is very good especially with MAINE 3A V1.3 [9],
which implements the spatial windowing technique [14,15],
allowing to compute with 1 or 2 spatial windows.
We observe experimentally in figure 13 that 2 spatial
windows overestimate the Transmission Loss and that 1
spatial window gives excellent result (as stated in [15])
particularly below the respiration frequency where SEA
underestimates systematically (compared to the intensity
measurement considered as the reference).
This is not surprising because the spatial windowing
is frequency dependent, which is not the case of SEA,
where the windowing effect is taken into account in the
non-resonant coupling loss factor
η
ij
(dominant here) by
the surface S (window area) to volume V
1
(emitting room)
ratio}:
€
η
ij
=
c
o
S
4
ω
V
1
τ
12
(5)
In equation 5,
τ
12
is the Power Transmission Coefficient of
the infinite poro-elastic multi-layer treatment. This
correction is sufficient above 315 Hz but not below, giving
the advantage to the spatial windowing technique.
Ray-Tracing Simulation
The ray-tracing codes that we have used to calculate the
transfer functions of the VASM are EBINAUR and ICARE
developed by the CSTB (Centre Scientifique et Technique
du Bâtiment) [16,17].
EBINAUR is based on a weighted gaussian’s beam
formulation, takes into account reflection on plane
Fig. 16 : Transmission Loss : measurement versus simulation
Vehicle Acoustic Synthesis Method 2nd Generation: an effective hybrid simulation tool to implement acoustic lightweight strategies